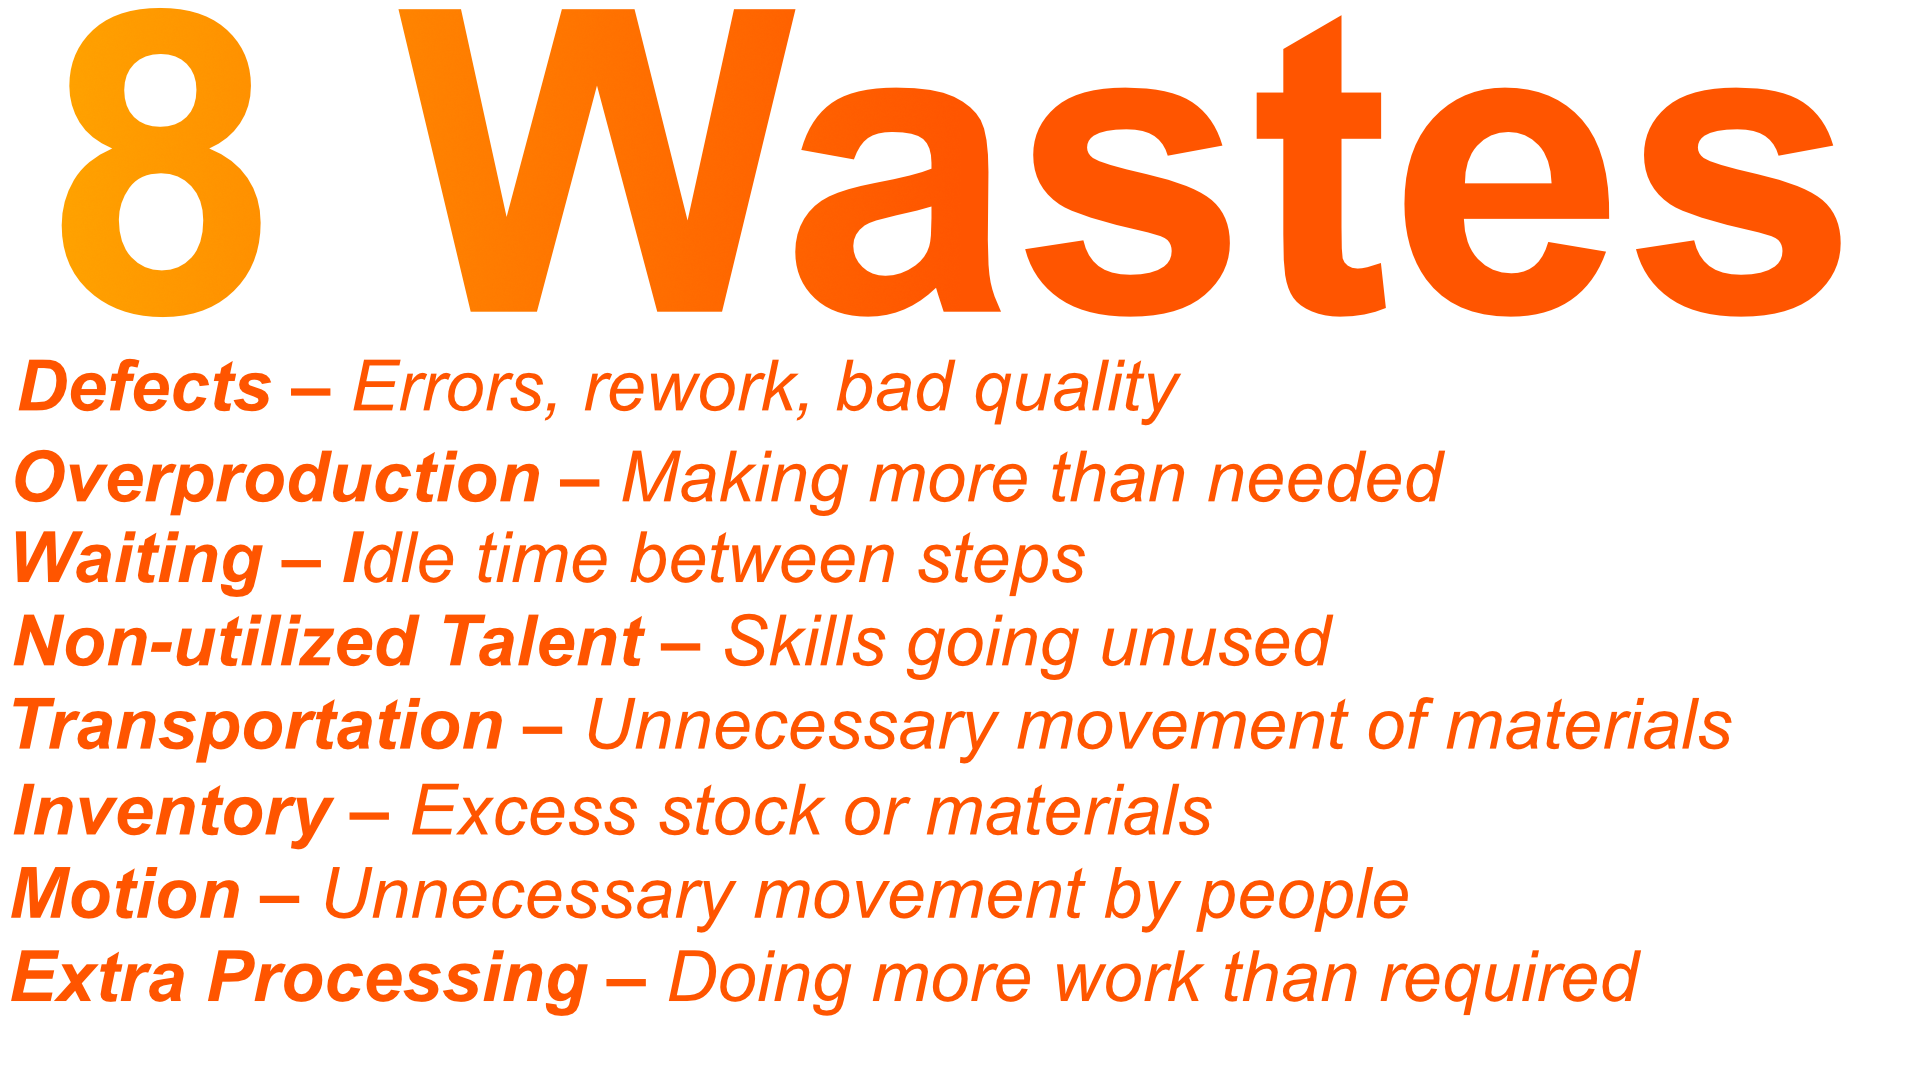
8 Wastes
Lean’s 8 wastes — quick, visual explainer.

Nursing Shortage
Why nursing burnout and education bottlenecks are fueling a crisis.
Moon Day
The Apollo missions, their legacy, and why they still inspire wonder.
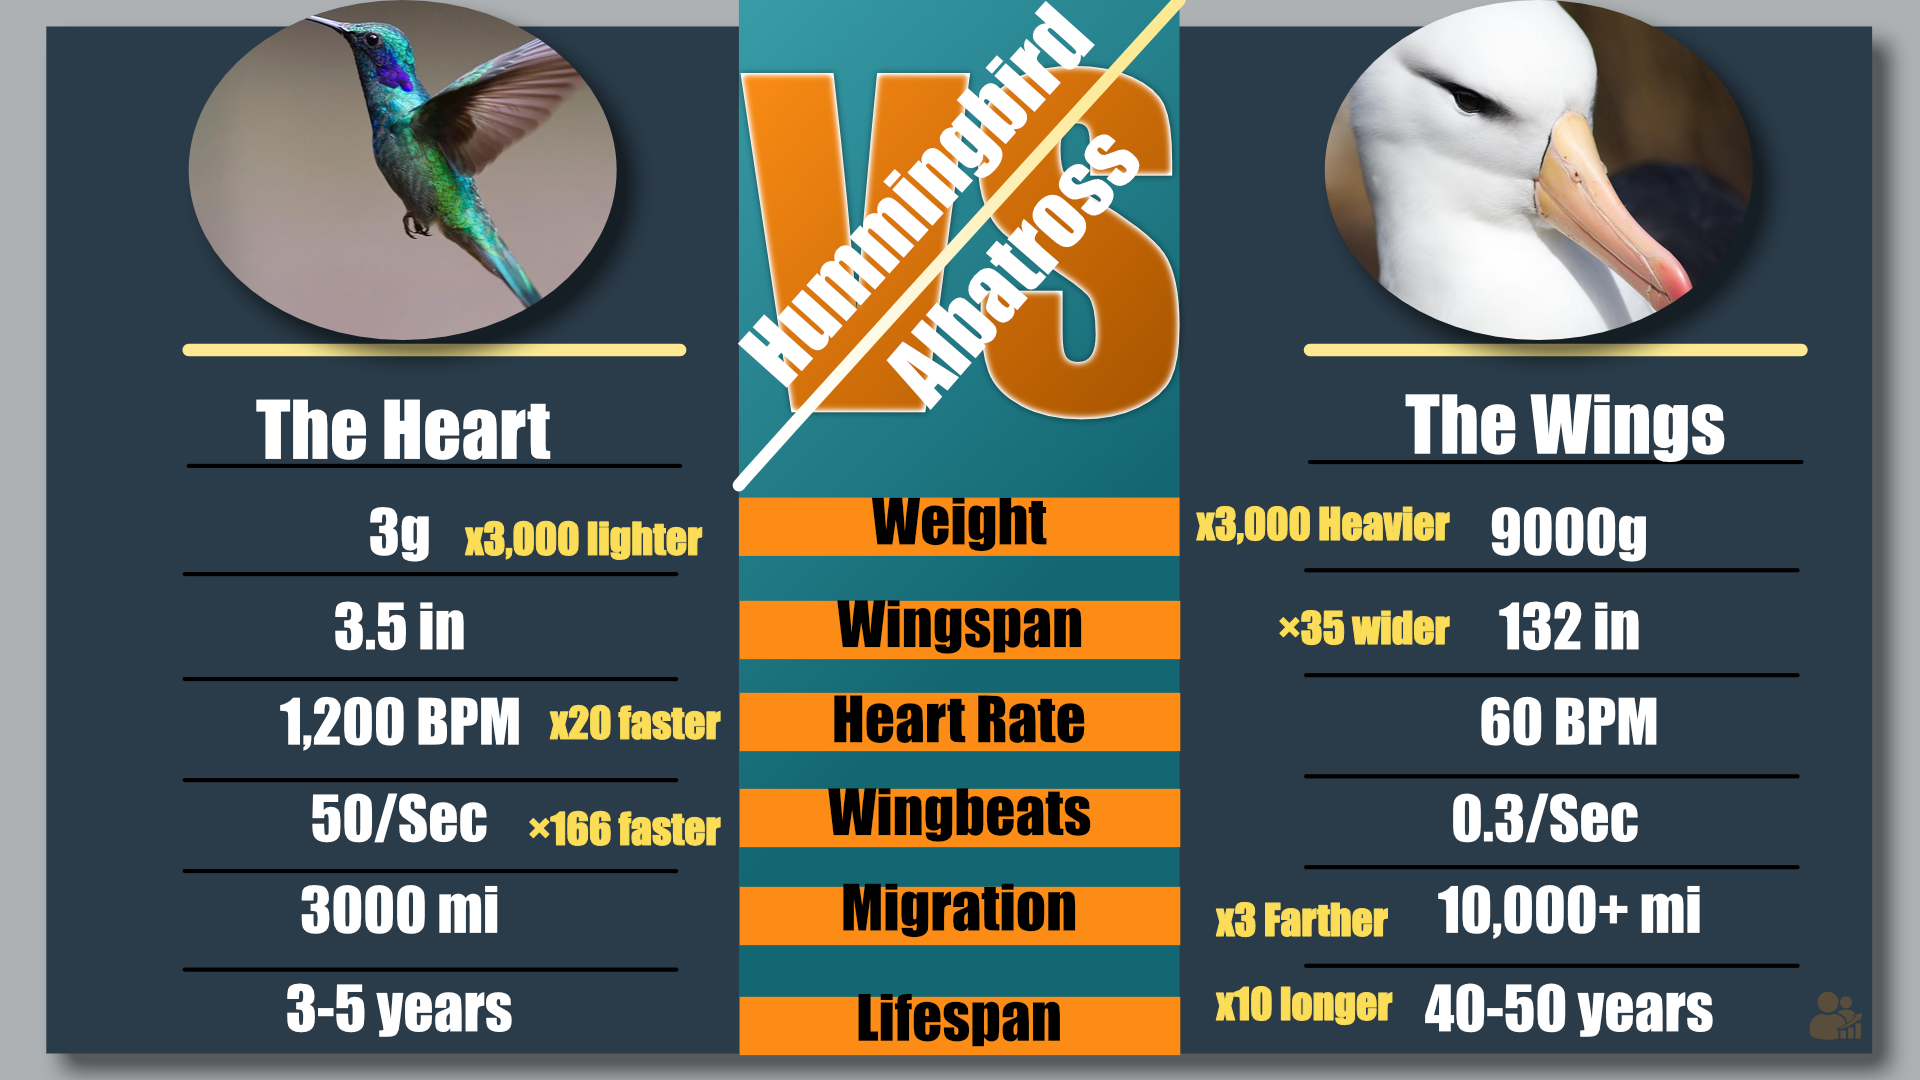
Hummingbird vs Albatross
Two extremes of flight — the hummingbird’s speed and the albatross’s endurance, narrated by Chuck & the Orb.
VOC / VOO / VOP
Breaking down three similar-sounding metrics you keep mixing up.
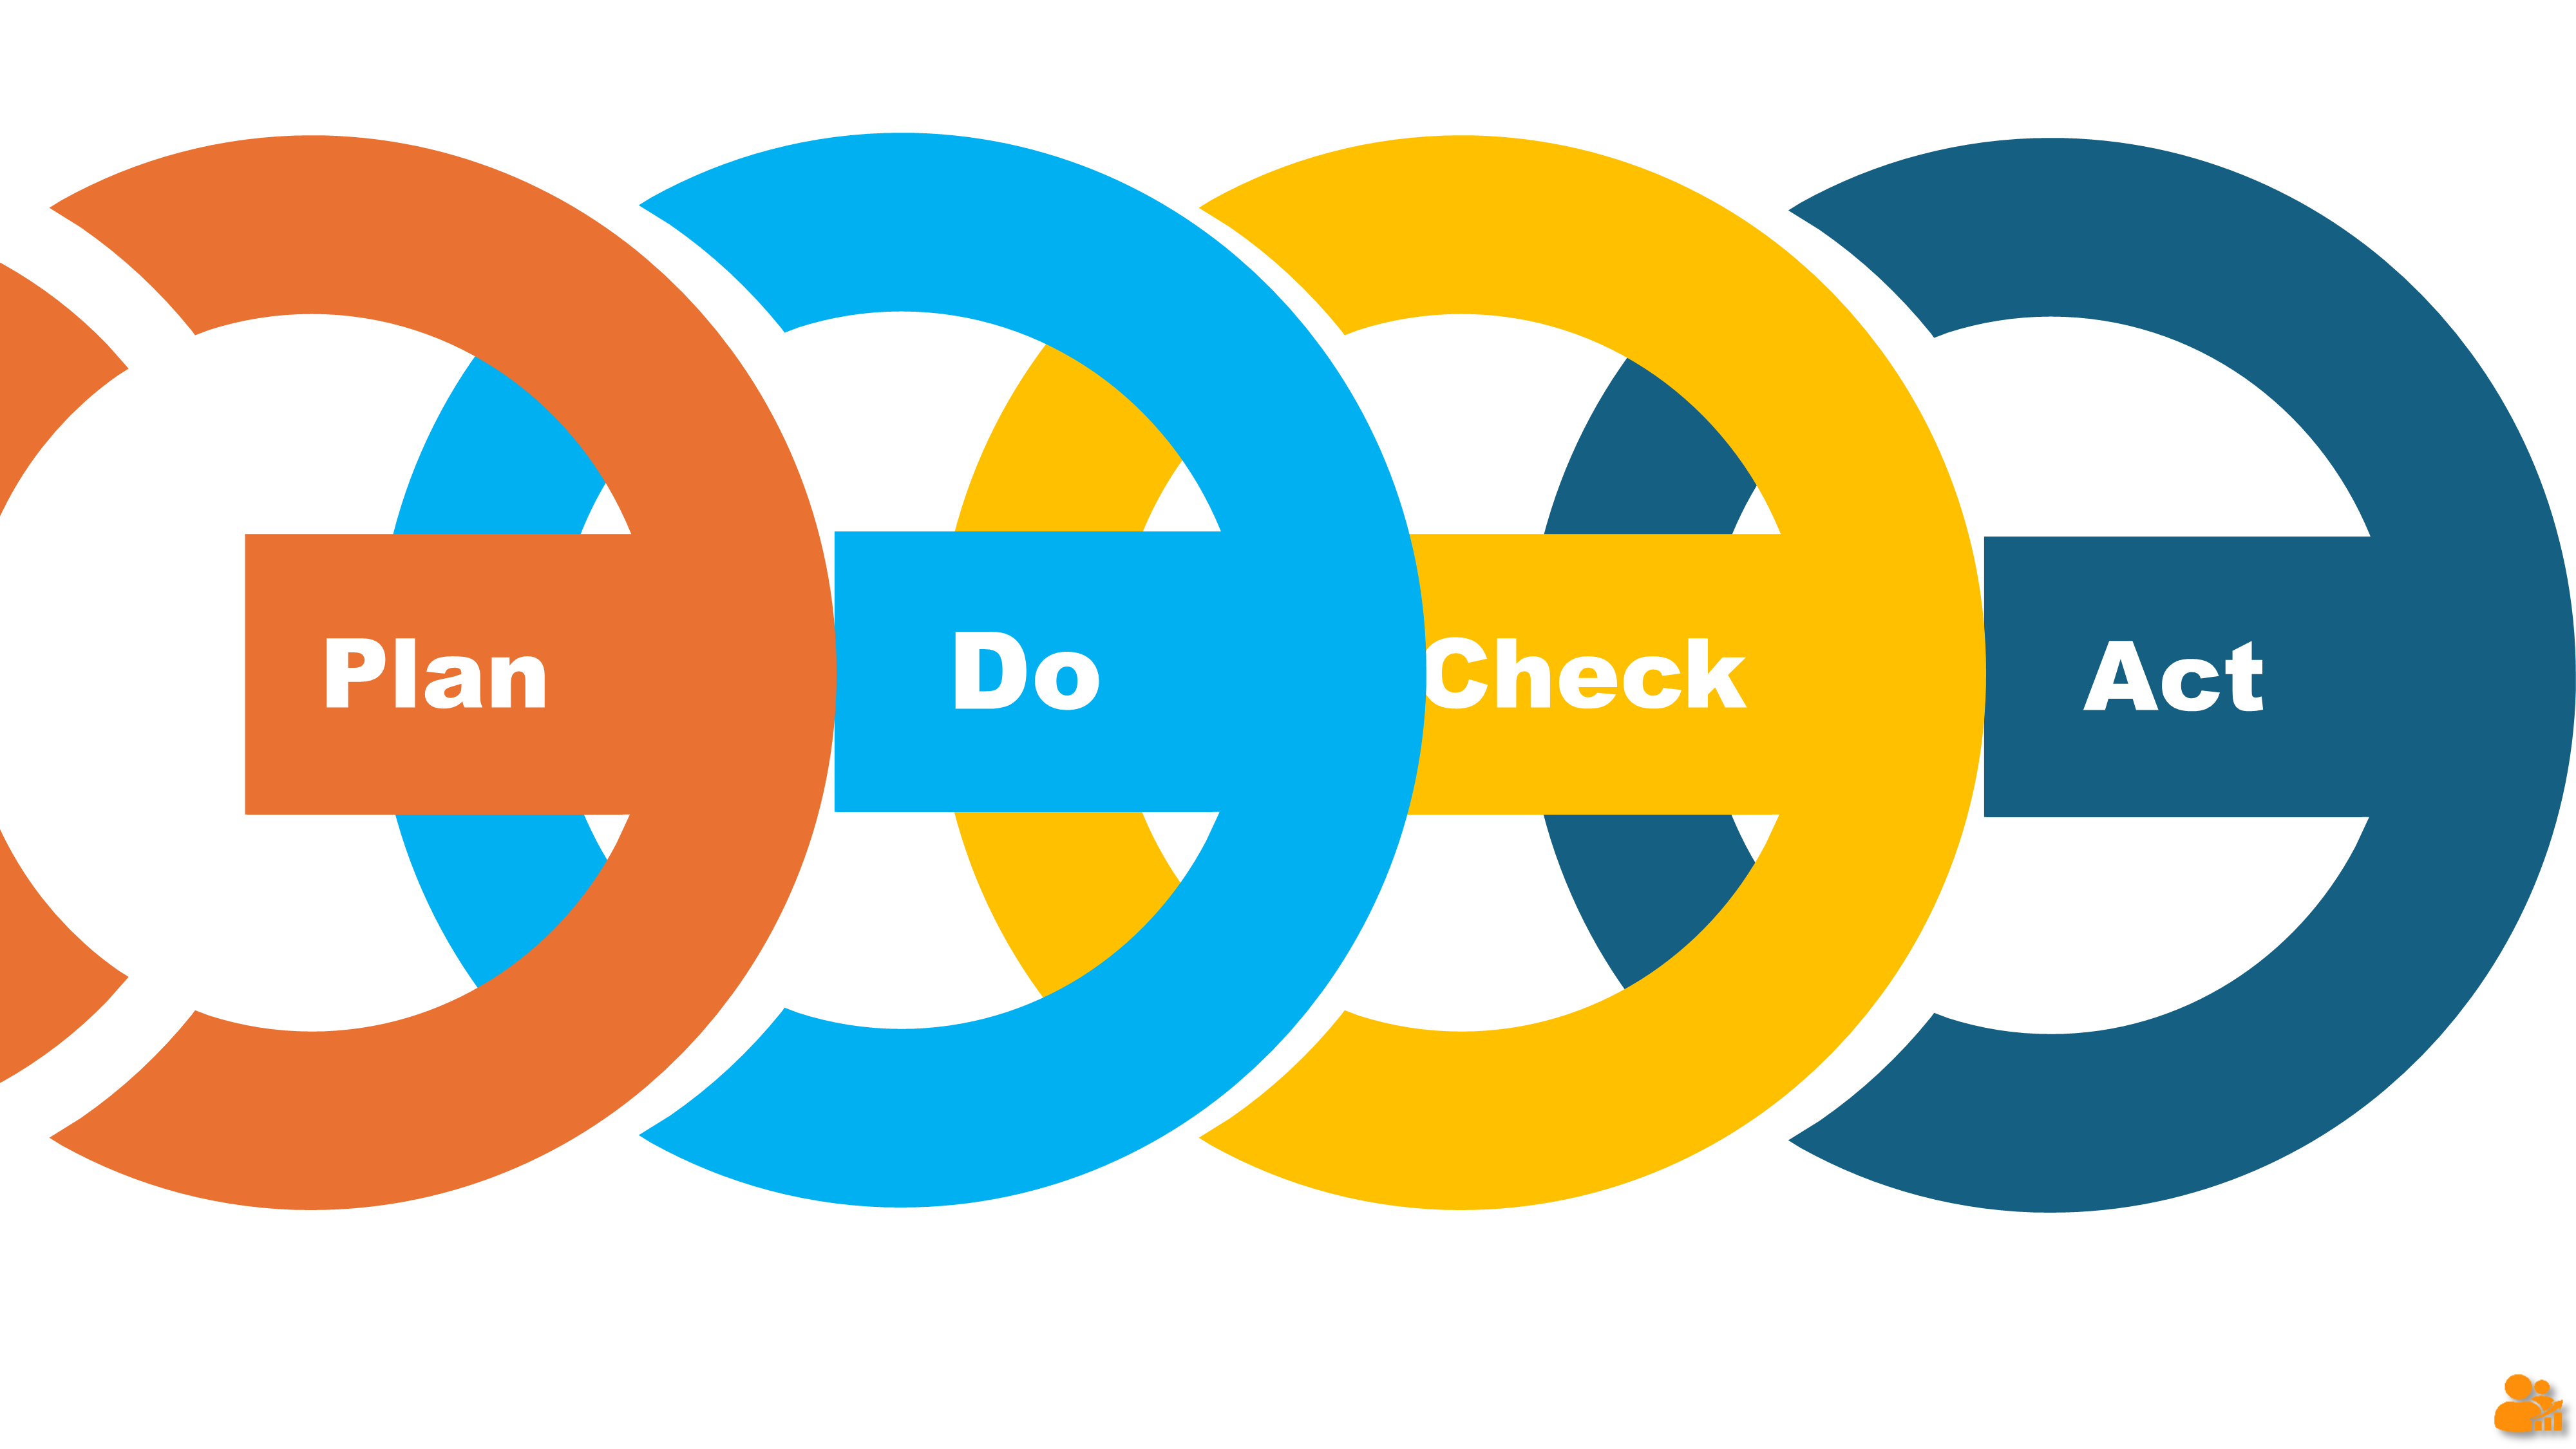
PDCA Cycle
The Plan-Do-Check-Act cycle explained with real-world examples.
Sling Blade Streaming Rights
Why this Oscar-winning film vanished from major streaming platforms.
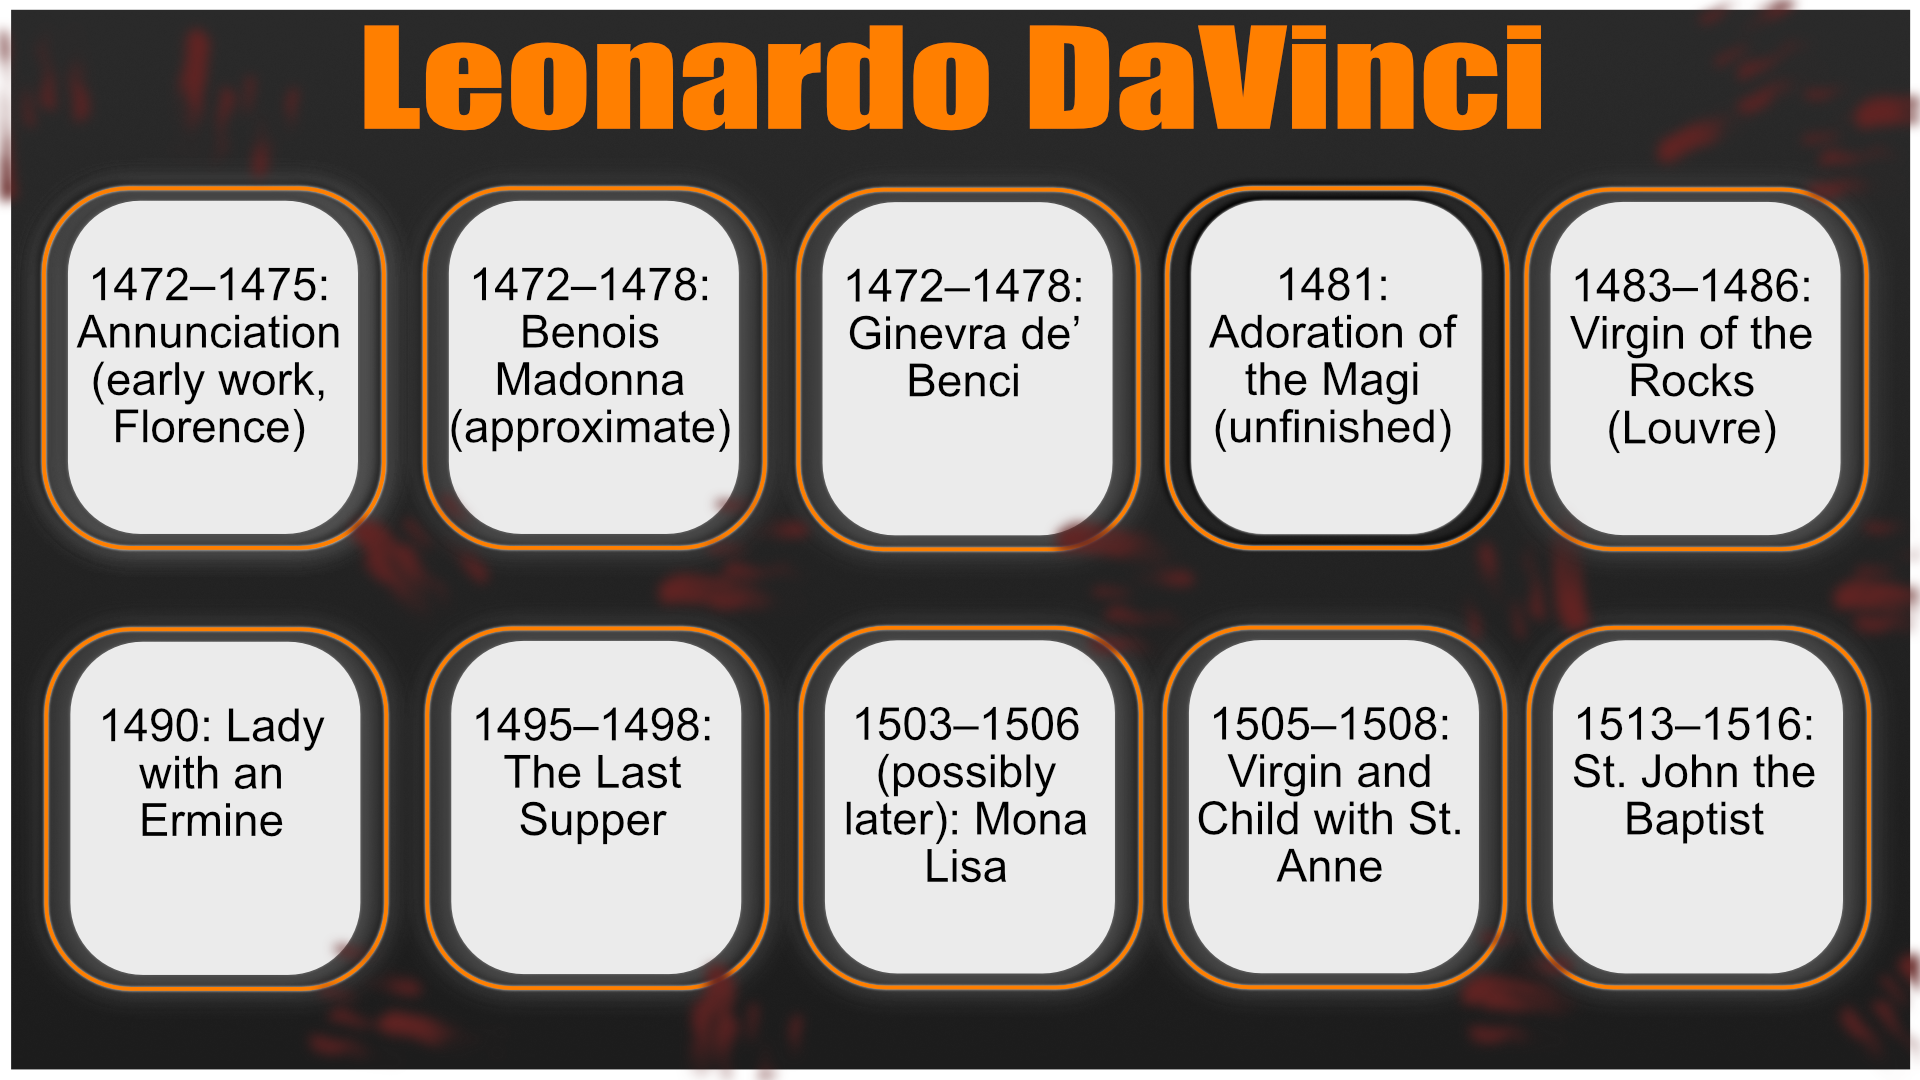
Da Vinci Data Story
What Leonardo da Vinci’s notebooks reveal about curiosity and method.
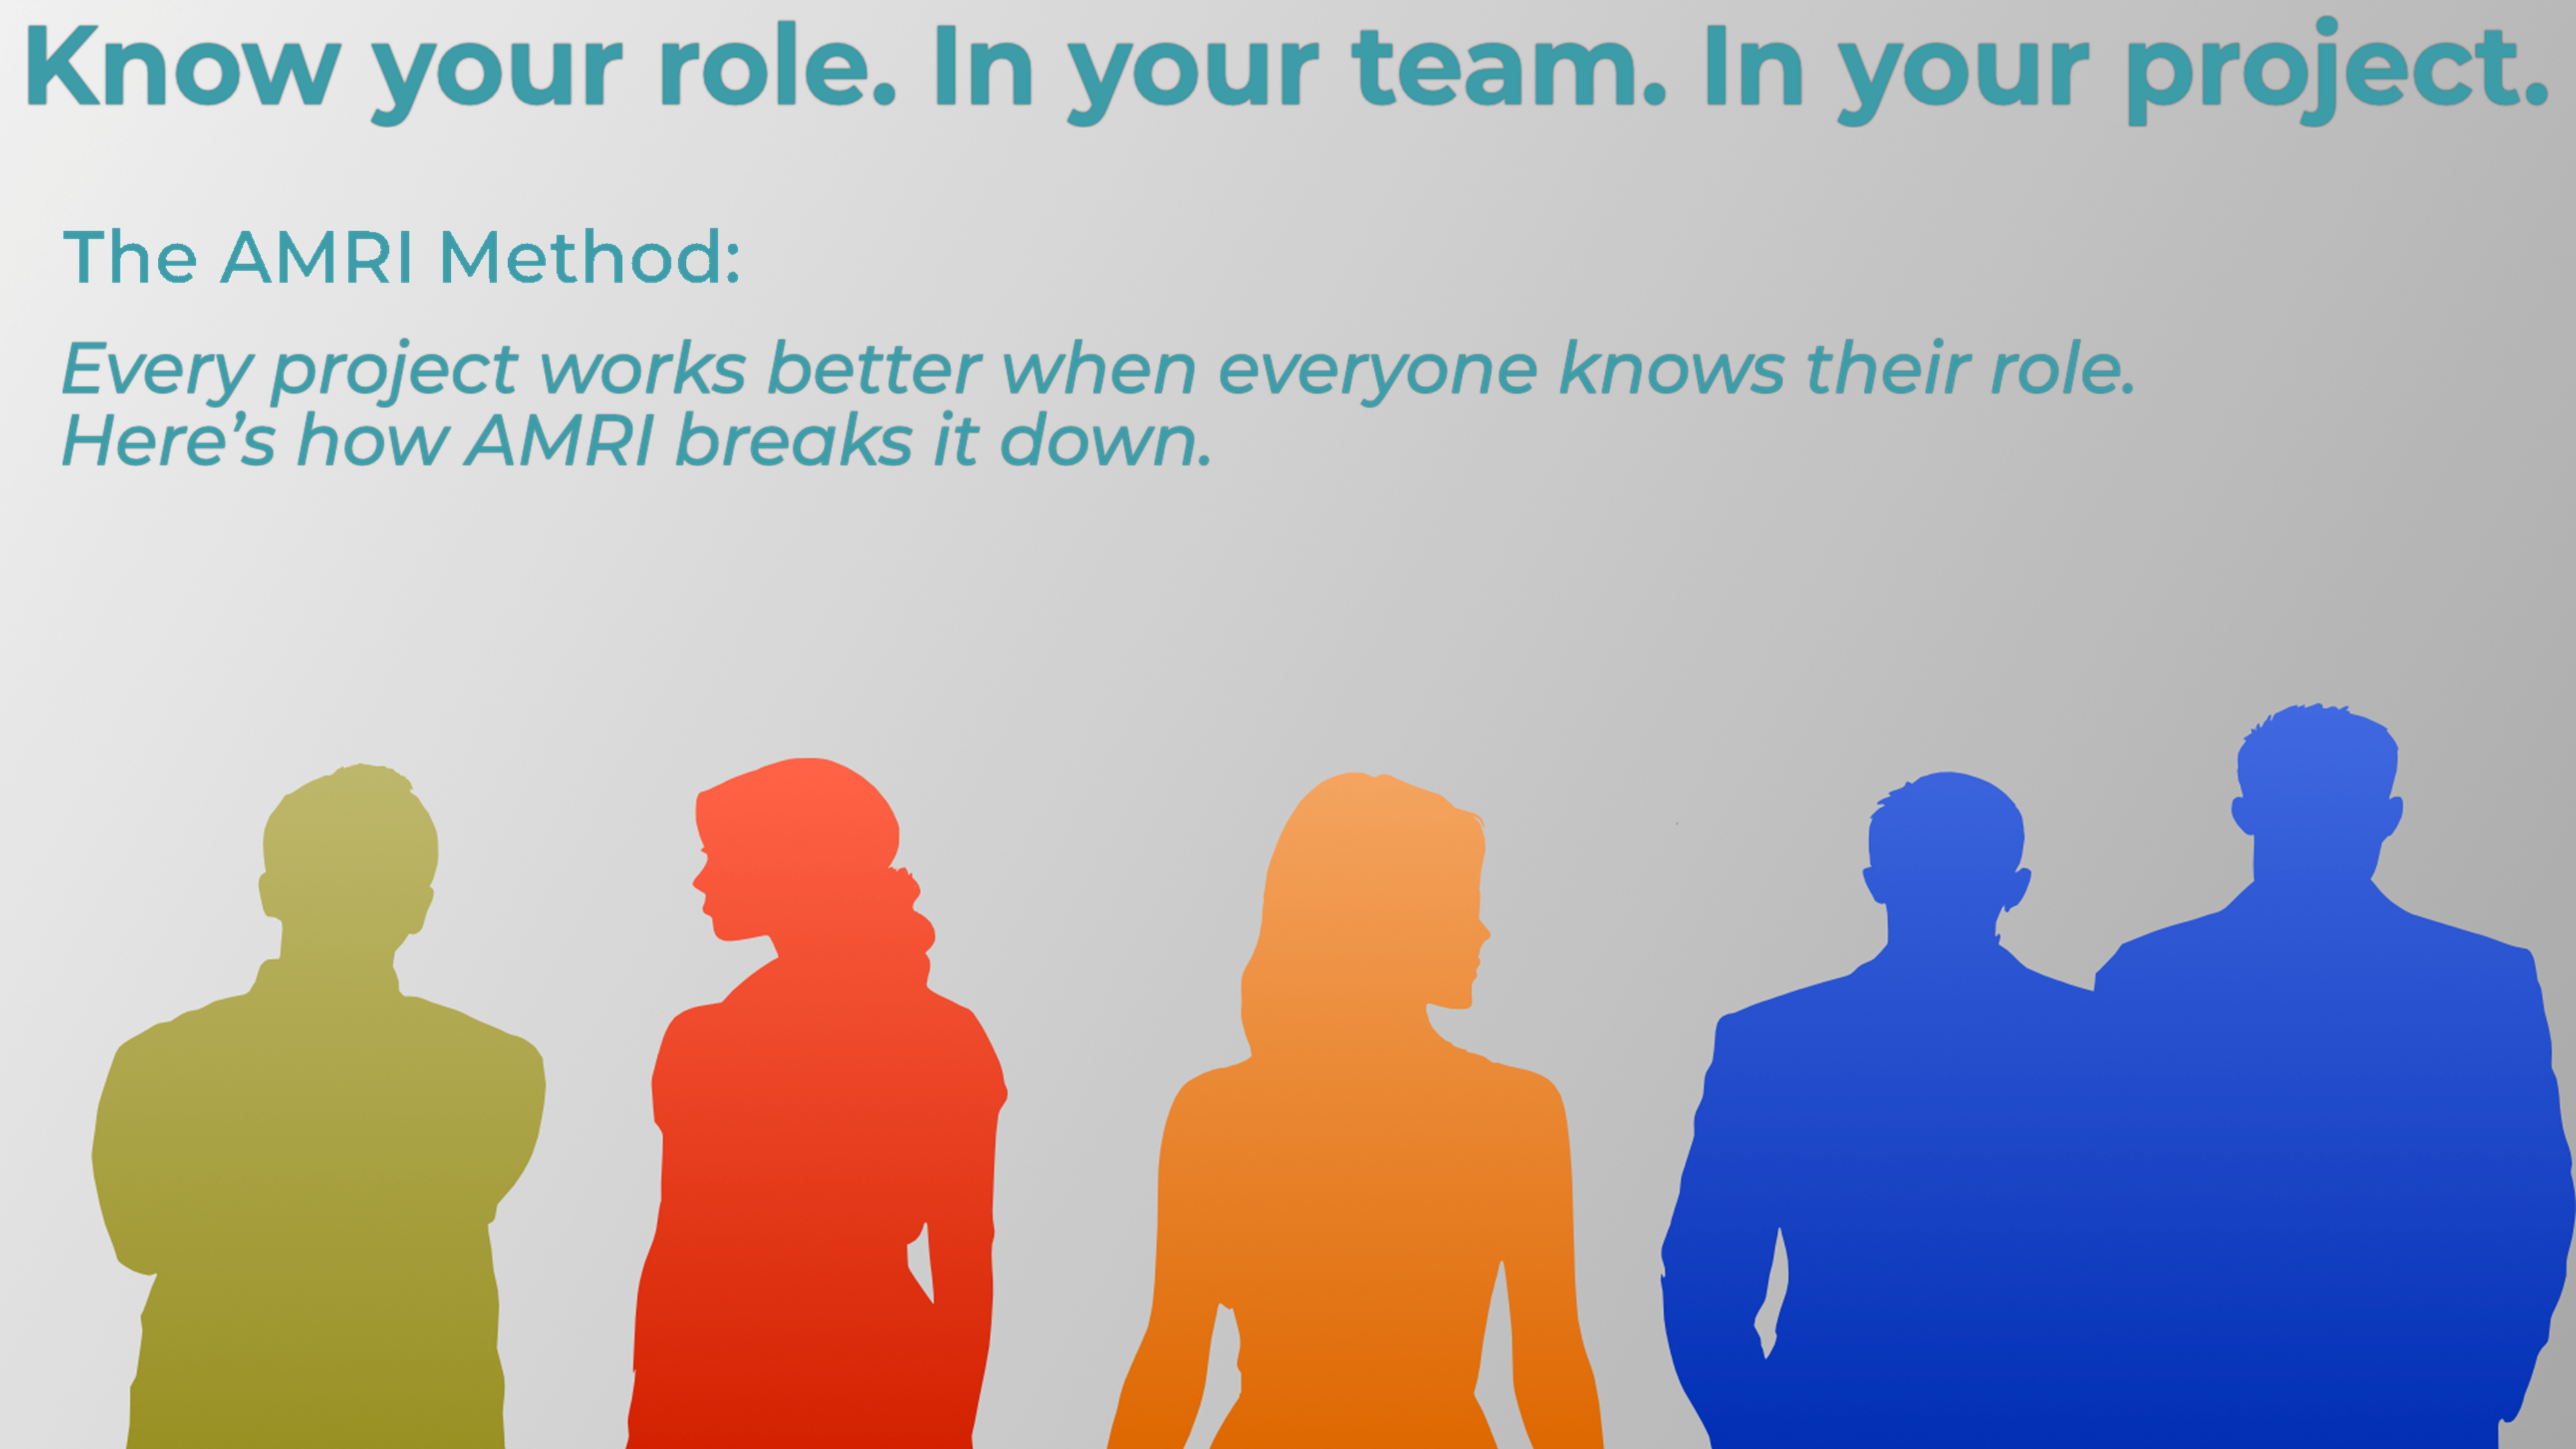
AMRI — Project Roles
Approver, Member, Resource, Informed: know your role and ship smarter.

Payday Loan Trap Explained
How a $300 payday loan balloons to $660 in fees — and you still owe $300.
