📊 Power BI Project Tracker
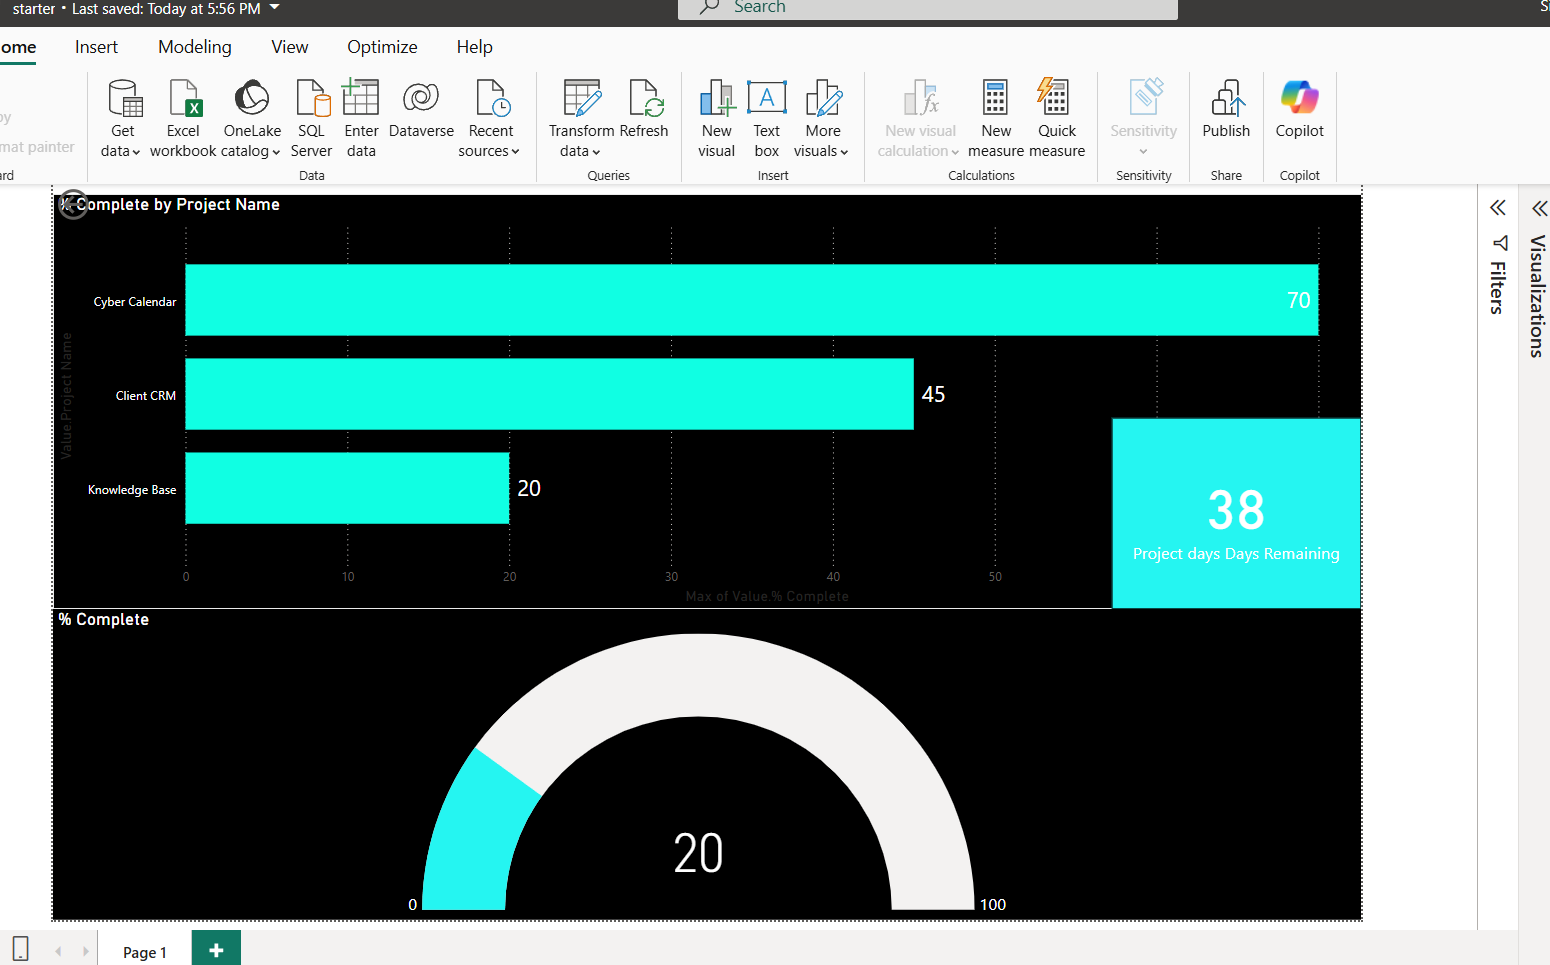
Tracks multiple projects with progress meters, completion %, and remaining days—clean, bold visuals made for action.
📈 Category Trend Analyzer
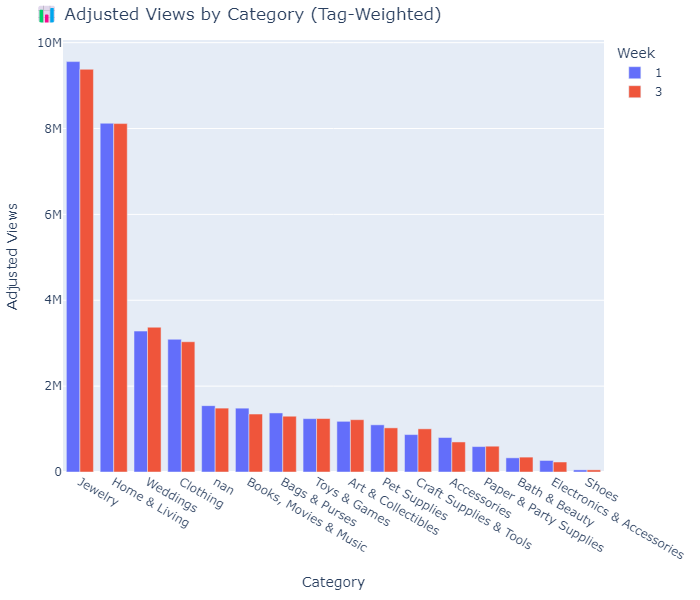
Plotly chart tracking tag-weighted views by category over time. Used to highlight shifts in buyer behavior week over week.
🐎 CyberHorse Predictor
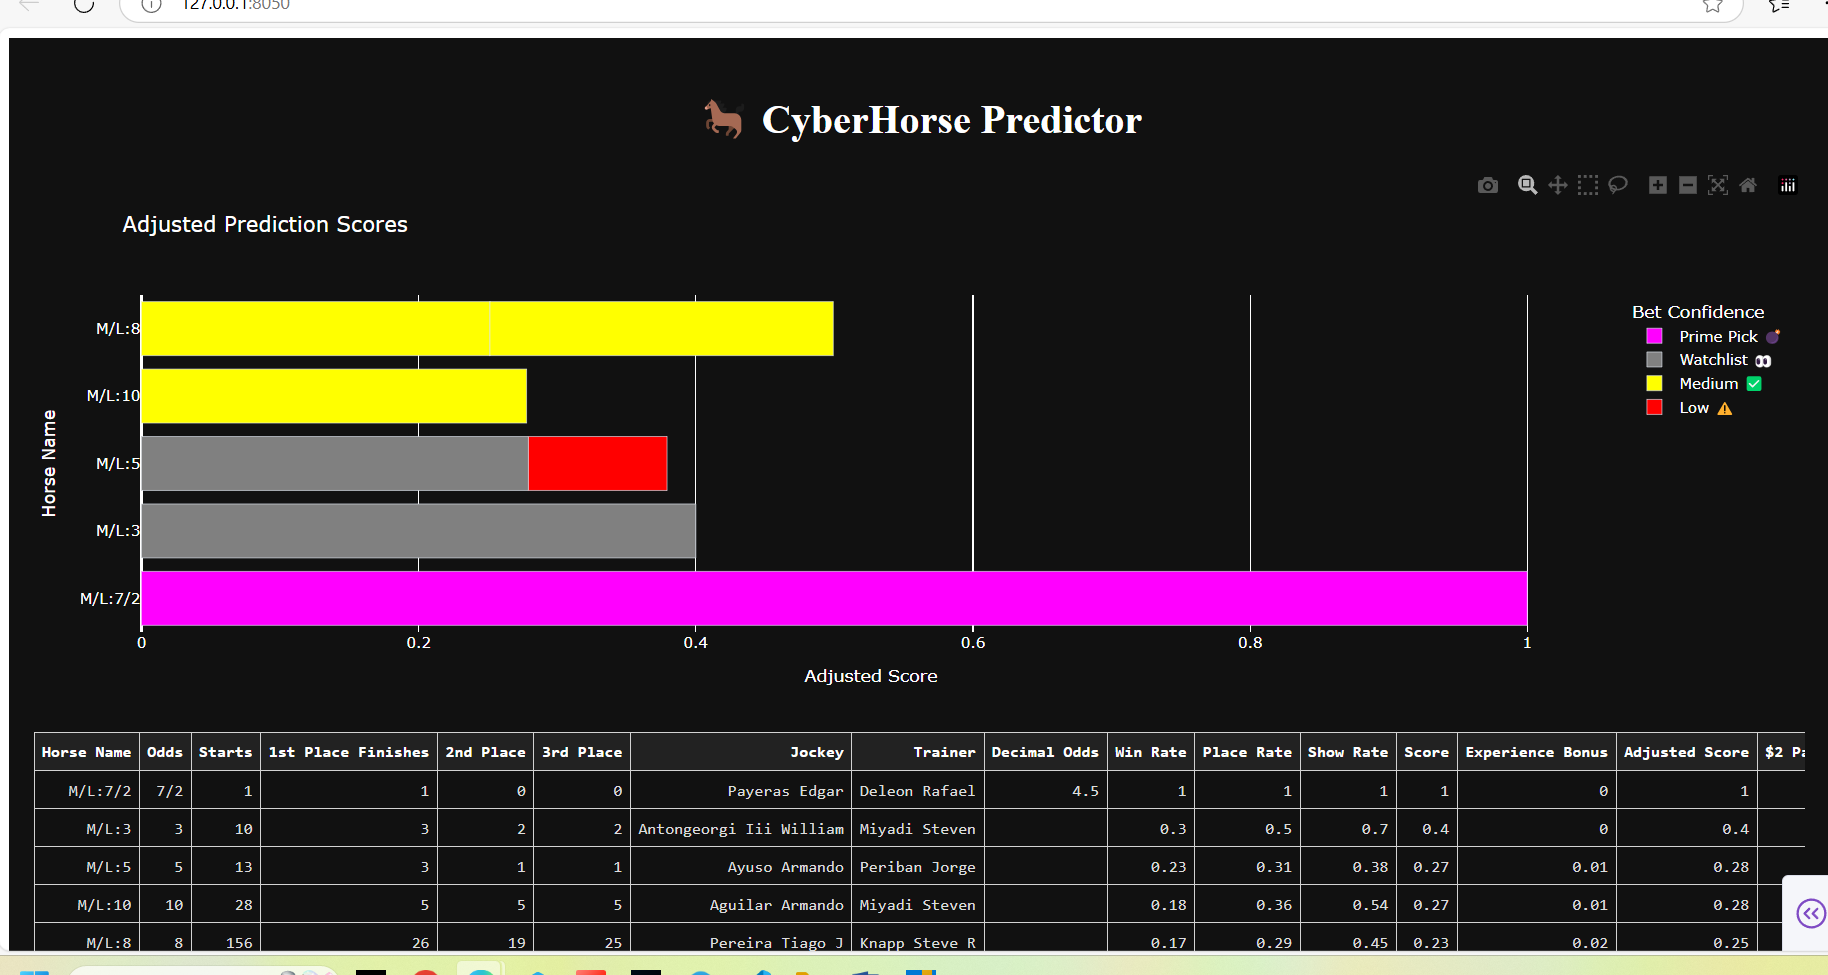
My own odds-adjusted prediction tool for racing analytics. Built with Dash, styled in high contrast, and live-calculated scores.
🏇 EV-Tiered Horse Ranking
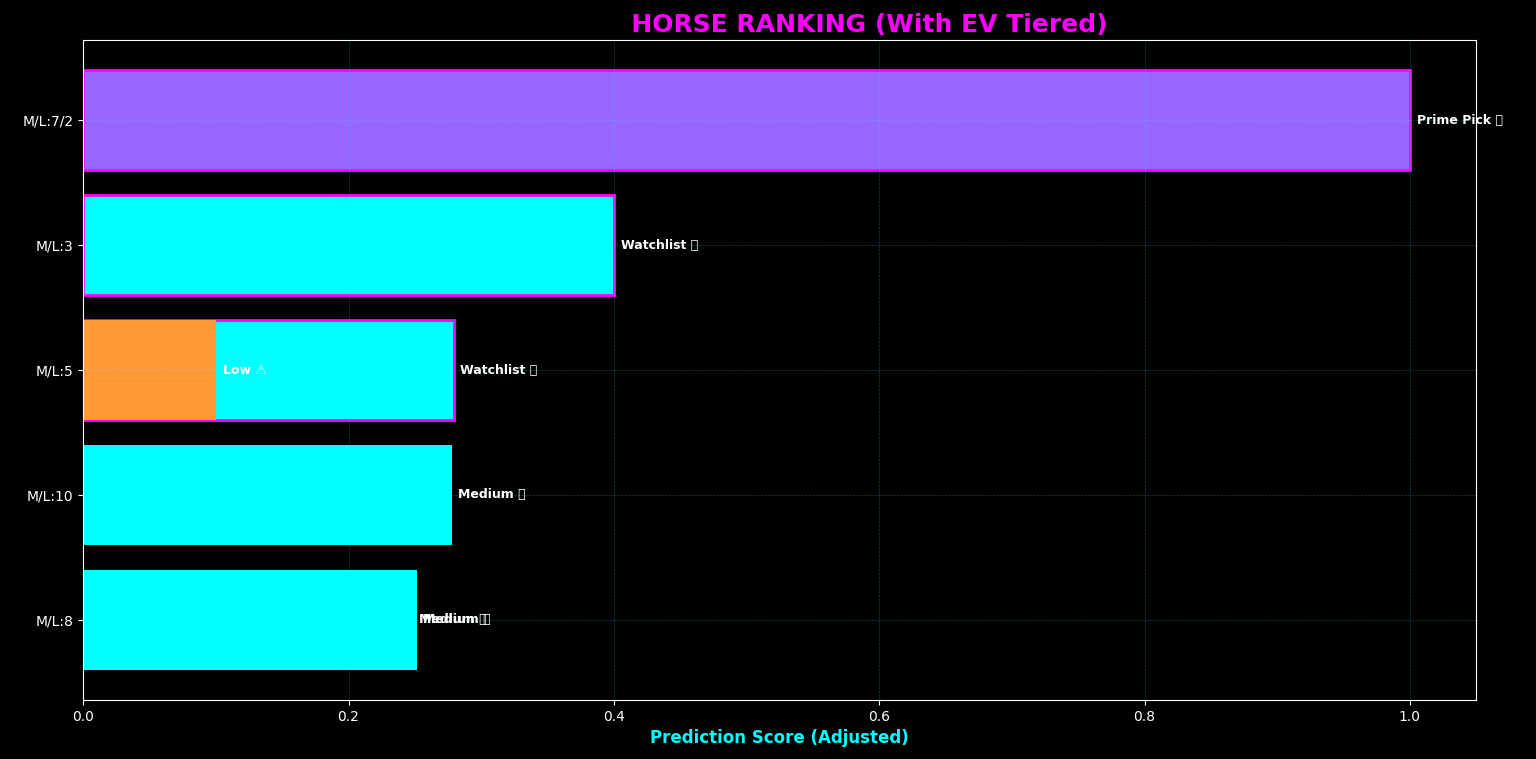
Color-coded rankings for expected value betting. Reinforces prime picks and watchlist tiers. Built for bettors, works for traders too.
🛍️ Etsy Insights Dashboard
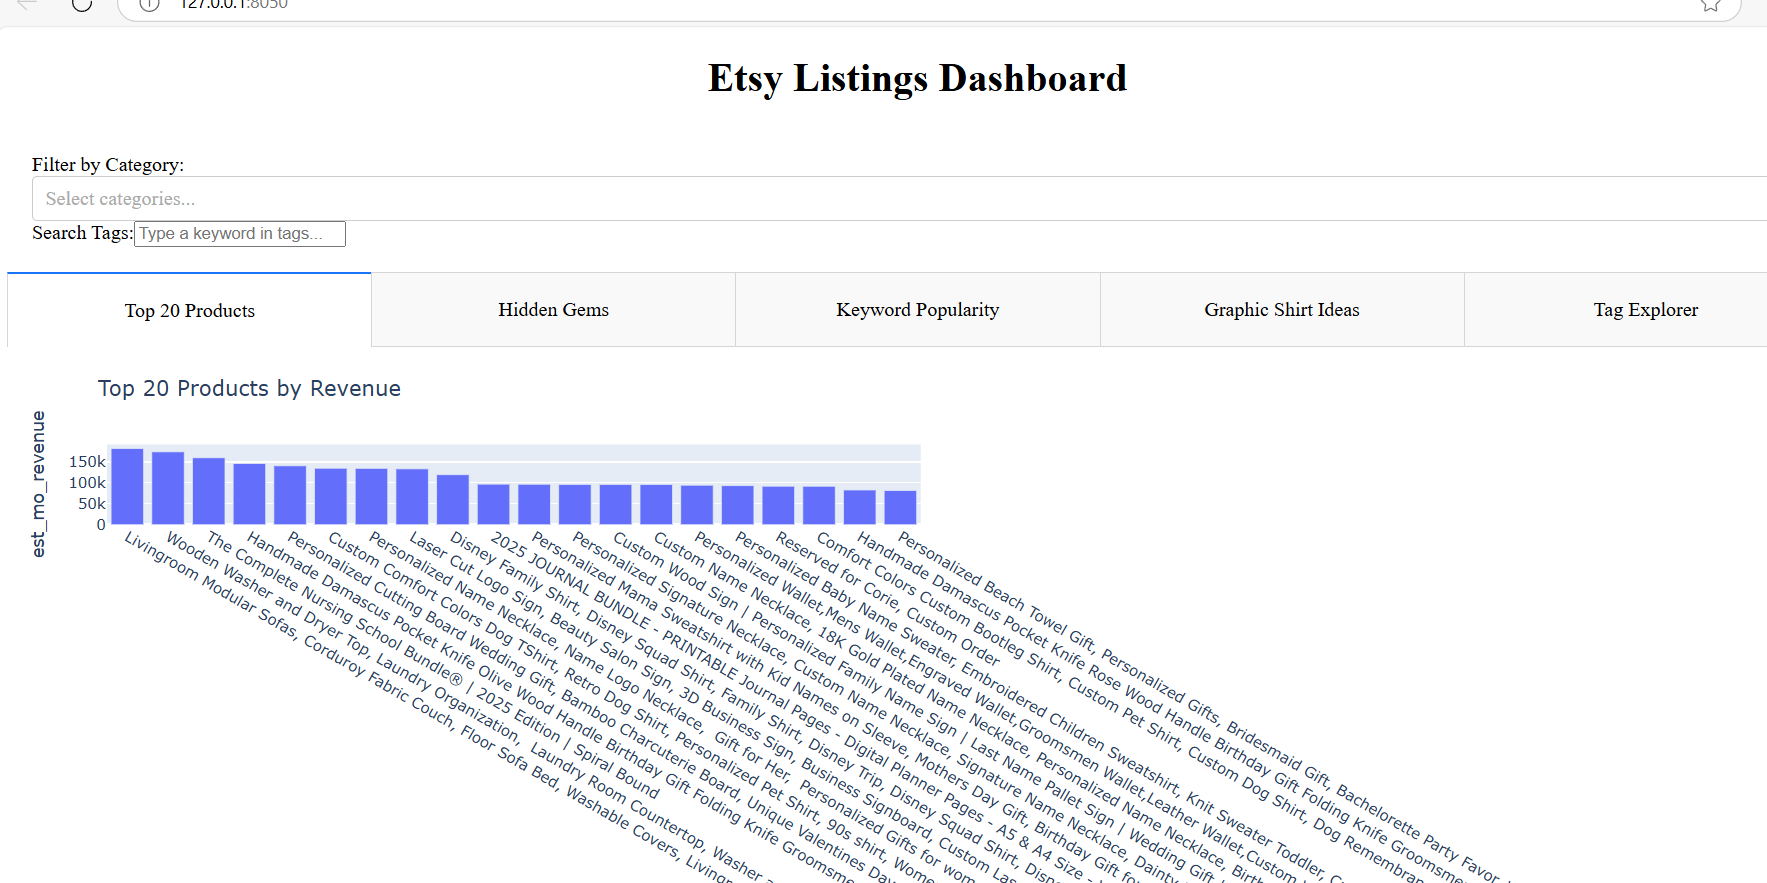
Top 20 product analyzer with filterable tags and categories. Clients use it to understand high-performing listings at a glance.
📌 Hidden Gems Bubble Chart
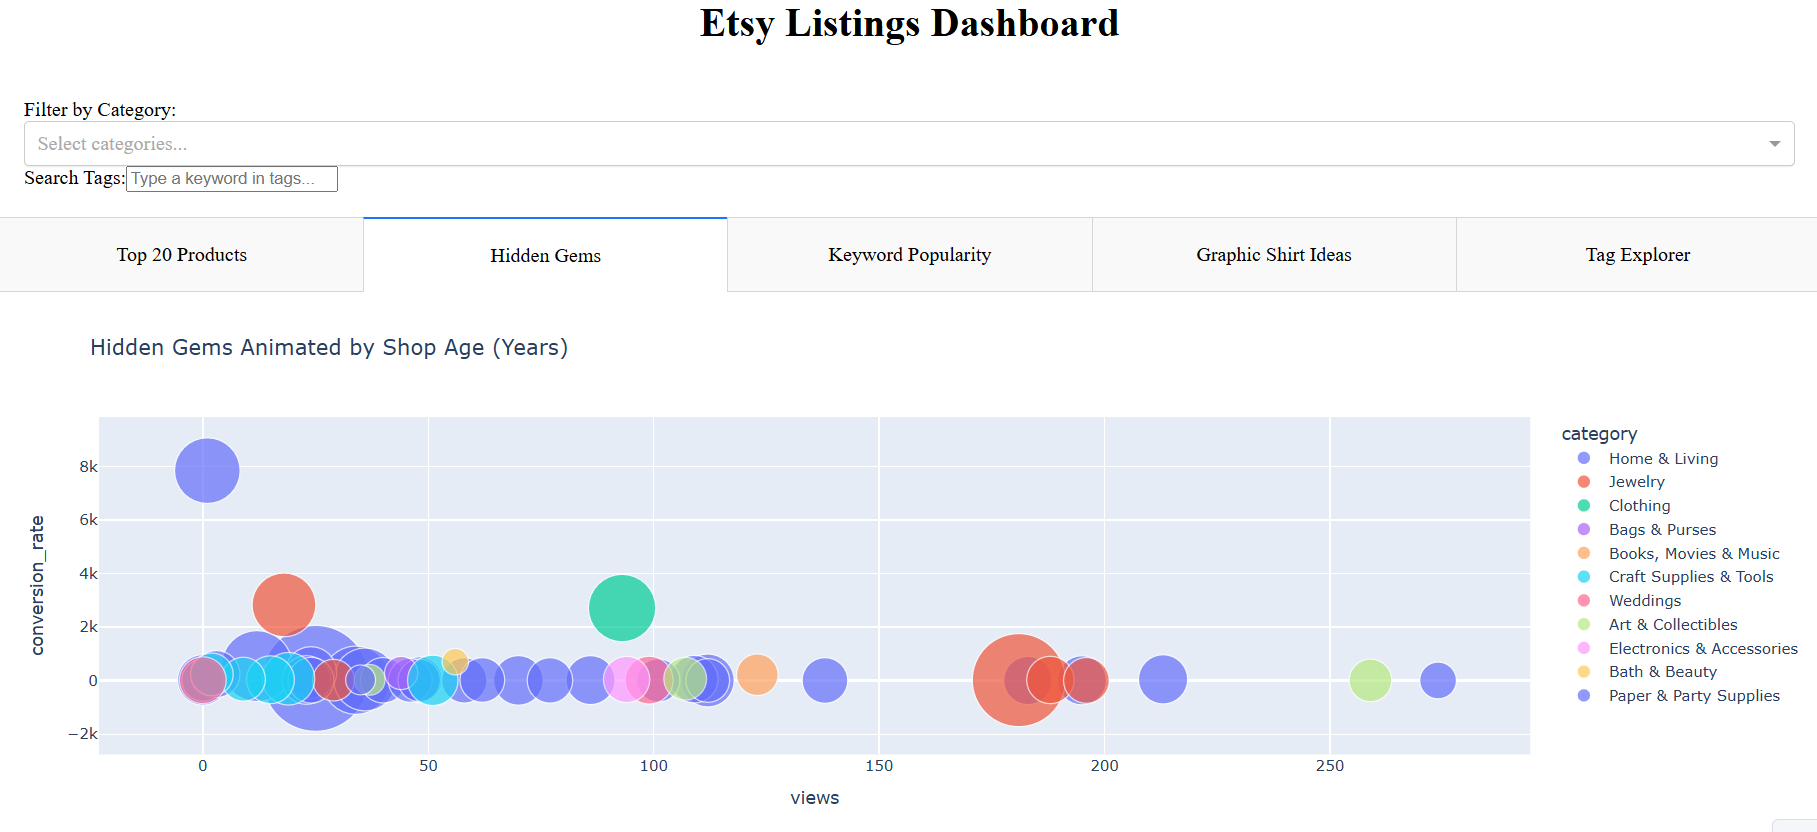
Bubble chart that surfaces high-conversion low-traffic products. Built with Plotly Express and tied to real-time shop filters.
🚚 Dispatch Tracker
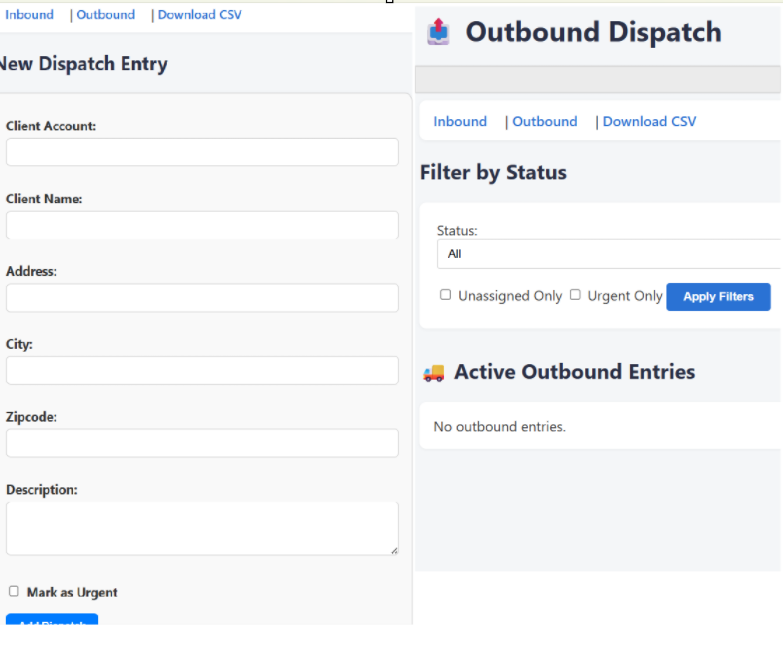
Lightweight dispatch board for managing job assignments. Features client filters, outbound tracking, and CSV exports.
